

Low Carbon Concrete Mix Optimization: Tarantula Curve, Aggregate Gradation, and Cement Reduction
Low carbon concrete is no longer just a sustainability goal. It is becoming a project requirement. Ready mix producers are seeing more bids that ask for EPDs, GWP limits, Buy Clean documentation, and lower carbon mix options. The challenge is practical: how do you reduce the carbon footprint of concrete without creating problems with strength, set time, finishability, pumpability, durability, or cost?
The answer is usually not one magic material. Most producers reduce concrete GWP through smart mix optimization. That can include better aggregate gradation, lower paste demand, reduced cement content, supplementary cementitious materials, portland limestone cement, admixtures, and performance-based specifications that give the producer room to design the mix properly.
The Tarantula Curve is one useful tool in that process. It helps producers look at aggregate gradation in a more practical way, so the mix has enough fine, intermediate, and coarse particles to pack well and stay workable. Better packing usually means less paste is needed. Less paste often means less cement. Less cement usually means lower GWP.
For ready mix producers, the real goal is simple: create the lowest practical GWP mix that still works in the field.
Key Takeaways
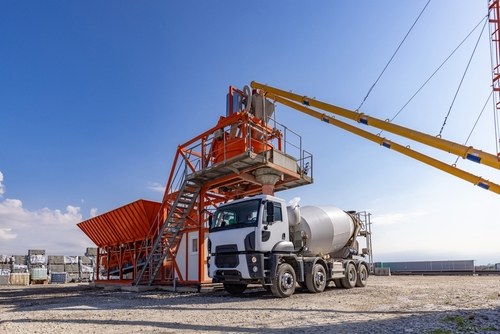
- The fastest way to lower concrete GWP is usually to reduce unnecessary cementitious content. Cement is often the largest carbon driver in ready-mix concrete, so even small reductions can matter across large project volumes.
- Aggregate gradation affects carbon because it affects paste demand. A well-graded aggregate skeleton can improve workability and reduce the amount of cement paste needed to fill voids and coat particles.
- The Tarantula Curve gives producers a practical way to evaluate gradation. It helps identify gaps in aggregate sizing that can lead to harsh mixes, excess paste, high water demand, segregation, or finishability issues.
- SCMs, PLC, admixtures, and performance-based specs can unlock deeper reductions. A 5% to 10% GWP reduction may come from cement type or minor optimization. A 20% to 30% reduction usually requires a more intentional mix strategy.
Why Mix Optimization Matters for Low-Carbon Concrete
Low carbon concrete requirements are showing up in public and private project specs. Producers may be asked to provide an Environmental Product Declaration, show a mix’s Global Warming Potential, meet a GWP limit, or demonstrate a percentage reduction below a baseline. On large projects, they may also be asked to provide total project carbon by mix and volume.
That makes mix optimization a business issue, not just a lab exercise. A producer that can quickly show lower-GWP options may be easier for contractors, engineers, DOTs, owners, and sustainability consultants to work with. A producer that has to scramble for mix data, EPDs, or carbon calculations may lose time during bidding.
The hard part is that low carbon concrete still has to behave like good concrete. It has to meet strength, durability, exposure, slump, air, finishability, pumpability, set time, and schedule requirements. The producer cannot simply cut cement and hope the mix performs.
Low carbon concrete is not just less cement. It is a better-balanced mix that meets the job with less carbon.
What Is the Tarantula Curve?
The Tarantula Curve is a mix design tool used to evaluate aggregate gradation. It plots the amount of each aggregate size in a concrete mix, from fine to coarse, and shows a recommended range for each size fraction. The chart looks a little like a spider’s legs, which is where the name comes from.
In simple terms, the Tarantula Curve helps answer this question: Do we have the right balance of small, medium, and large aggregate particles to make the mix workable without using too much paste?
That matters because concrete is mostly aggregate by volume. If the aggregate particles pack together well, there are fewer empty spaces to fill. If there are fewer empty spaces to fill, the mix may need less cement paste. If the mix needs less cement paste, the producer may be able to lower cement content and reduce GWP.
The Tarantula Curve does not automatically create a perfect mix. It is a guide. Producers still need trial batches, performance testing, slump checks, finishability feedback, strength results, durability review, and field input.
.png)
Why Aggregate Gradation Affects Cement Content
Aggregate gradation affects how much paste a mix needs. Paste is the combination of cementitious materials, water, and fine particles that fills voids and coats aggregate. Paste is necessary, but too much paste can increase cost, shrinkage, heat, and GWP.
A poorly graded mix may have too many particles of one size and not enough of another. That can create gaps in the aggregate skeleton. When those gaps exist, the producer often needs more paste to make the mix workable. The mix may also become sticky, harsh, segregating, difficult to pump, or difficult to finish.
A better-graded mix has a more balanced distribution of particle sizes. Smaller particles fit between larger particles. Intermediate particles help bridge the gap between sand and coarse aggregate. The result is a denser aggregate skeleton with lower paste demand.
That is the carbon connection. Better aggregate gradation can reduce the amount of cement paste needed to get the same performance. For producers trying to hit GWP limits, this is one of the most practical optimization levers because it may reduce carbon without relying only on SCM availability.
Aggregate gradation does not show up as a carbon material the way cement does, but it affects how much cement paste the mix needs.
The Carbon Logic: From Paste Demand to GWP Reduction
Most concrete GWP comes from cement and cementitious materials. Cement clinker is especially carbon intensive because CO2 is released both from fuel combustion and from the chemical process of making clinker. That means reducing unnecessary cement content can have a direct effect on the mix’s carbon footprint.
The practical logic looks like this:
- Improve aggregate gradation.
- Reduce voids in the aggregate skeleton.
- Lower paste demand.
- Reduce cementitious content where performance allows.
- Rebalance water, admixtures, SCMs, and workability.
- Confirm strength and durability.
- Update GWP and EPD data.
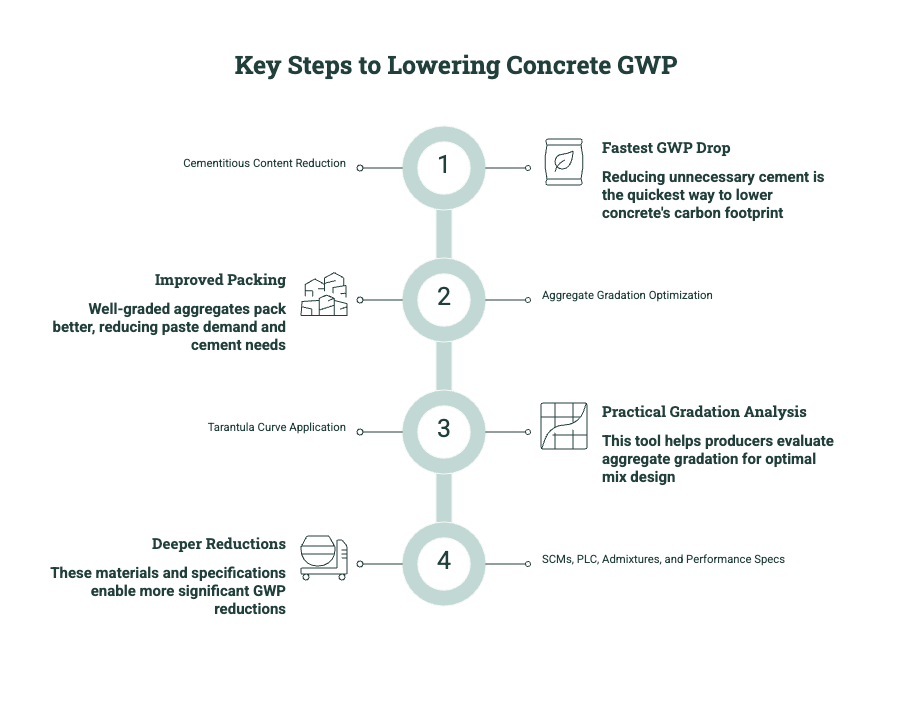
A small cement reduction can matter across a large project. For example, if a producer reduces cement content by 30 pounds per cubic yard on a 10,000 cubic yard project, that is 300,000 pounds of cement avoided. The GWP reduction depends on the cement EPD, but the project-level impact can be significant.
Simple cement reduction example
This is why mix optimization matters most on high-volume mixes. A small reduction on a slab, foundation, paving, or warehouse mix can matter more than a big reduction on a small specialty pour.
Tarantula Curve vs. Traditional Gradation
Traditional gradation checks often look at combined percent retained or percent passing across sieves. That is useful, but it may not always show how the mix will behave in the field. The Tarantula Curve gives producers another way to see where the aggregate blend may be causing workability problems.
A mix can meet a traditional gradation band and still feel sticky, rocky, harsh, or hard to finish. That may happen because the mix has too much fine material, not enough intermediate aggregate, or poor particle shape. The Tarantula Curve helps highlight those problems more clearly.
For ready-mix producers, the value is not the chart itself. The value is the conversation it creates between QC, technical services, operations, and the field. If finishers say the mix is sticky, pump operators say it is hard to move, or drivers report water demand issues, aggregate gradation may be part of the problem.
What the Tarantula Curve can help identify
- Too much fine aggregate
- Too little intermediate aggregate
- Too much coarse aggregate
- Gap-graded blends
- High paste demand
- Segregation risk
- Sticky mixes
- Harsh mixes
- Excess water demand
- Potential finishability issues
The goal is not to force every mix perfectly into a chart. The goal is to use the chart to make smarter adjustments and reduce unnecessary paste.
Practical Mix Optimization Levers
Low-carbon concrete usually comes from combining multiple strategies. One lever may get a 5% reduction. Several coordinated levers may get 15%, 20%, or more. The right strategy depends on the project, materials, region, schedule, and spec.
1. Optimize aggregate gradation
Aggregate gradation is often the first place to look because it affects paste demand. Producers can review the combined gradation, adjust fine and coarse aggregate proportions, add intermediate aggregate where available, and evaluate whether particle shape is increasing water demand.
This strategy can be especially useful when SCM supply is limited or when the project has tight performance requirements. It may also improve cost because reducing paste often reduces cementitious material cost.
2. Reduce unnecessary cementitious content
Many mixes are over-designed for safety, habit, or old spec language. That extra cement may help cover variability, but it also increases GWP and cost. Producers should review whether the cementitious content is truly needed for strength, durability, placement, and schedule.
The safest path is gradual. Reduce cementitious content in controlled steps, run trial batches, check strength curves, and confirm field performance. The goal is not to under-design the mix. The goal is to remove unnecessary over-design.
3. Use portland-limestone cement
Portland-limestone cement, often called PLC or Type IL in the U.S. and GUL in Canada, can reduce GWP by lowering clinker content. It is often one of the easiest first levers because it can be used as a direct replacement in many cases where accepted by the spec and local standards.
At the total mix level, PLC may support a modest reduction, often in the range of 5% to 10% depending on the mix and cement data. It may not be enough by itself for aggressive GWP limits, but it can help producers move in the right direction.
4. Use SCMs carefully
Supplementary cementitious materials can provide deeper reductions. Common SCMs include slag, fly ash, silica fume, natural pozzolans, calcined clay, and glass pozzolans. These materials can replace a portion of portland cement and lower GWP.
SCMs are powerful, but they are not automatic. They can affect early strength, set time, finishing, curing sensitivity, color, durability, and availability. A 20% fly ash mix may be straightforward in one market and difficult in another. A high slag mix may perform well but need attention to curing and early strength.
5. Use admixtures to support lower paste content
Admixtures can help producers maintain workability while lowering water or paste demand. Water reducers and superplasticizers can make it easier to reduce cementitious content while keeping the mix placeable.
This is especially important when optimizing aggregate gradation. A denser aggregate skeleton may reduce paste demand, but the mix still needs to move, pump, consolidate, and finish. Admixtures help bridge the gap between carbon reduction and field performance.
6. Ask for performance-based flexibility
Some low-carbon options are blocked by prescriptive specs. If a spec requires a high minimum cement content, caps SCMs too low, or demands unnecessary early strength, the producer may not have room to optimize. Performance-based specs help because they define what the concrete must achieve rather than dictating the recipe.
A performance-based approach can still protect the project. It can require strength, exposure, durability, air, shrinkage, permeability, finishability, and GWP. It just gives the producer flexibility to meet those requirements with a better mix design.
How Much GWP Reduction Is Realistic?
The realistic reduction depends on the starting mix. A producer with already-optimized mixes may not find huge reductions. A producer with high paste content, old prescriptive mixes, or limited SCM use may have more room to improve.
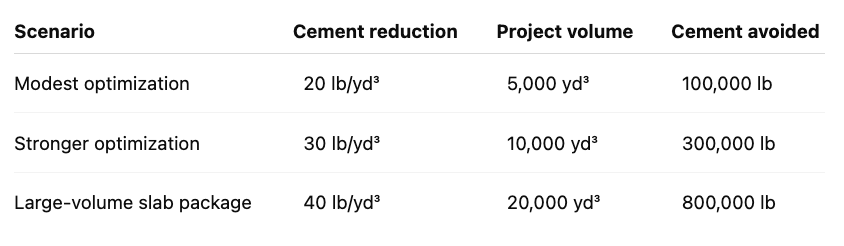
Use these as practical planning ranges:
The important word is combined. Producers often need more than one lever. PLC might get part of the way. Gradation optimization might reduce paste demand. SCMs might provide the deeper carbon reduction. Admixtures might preserve workability. Performance-based specs might make the whole package possible.
“A 10% reduction may be a material swap. A 30% reduction is usually a mix design strategy.”
Baseline and Reduction Math for Mix Optimization
Low-carbon concrete is usually measured against a baseline. The baseline may come from an industry average, a regional benchmark, a state GWP table, a project-specific business-as-usual mix, or a previous mix used on similar work.
The formula is simple: Reduction percentage = (Baseline GWP - Proposed Mix GWP) ÷ Baseline GWP × 100
Example: reducing a 4,000 psi mix
A project uses a baseline of 360 kg CO2e/yd³ for a 4,000 psi mix. The producer’s current mix has a GWP of 345 kg CO2e/yd³. After aggregate gradation optimization, PLC, and moderate SCM adjustment, the proposed mix is 295 kg CO2e/yd³.
360 - 295 = 65 kg CO2e/yd³ reduction
65 ÷ 360 = 18% reduction
The optimized mix is 18% below the baseline.
Target table
This table helps producers turn a project requirement into a mix design target. If the spec says 20% below baseline, the team can calculate the target before changing the mix.

Step-by-Step Workflow for Low-Carbon Mix Optimization
Low-carbon mix optimization should be repeatable. It should not depend on one person manually pulling spreadsheets every time a project asks for a lower-GWP option.
Step 1: Start with the project requirement
Confirm what the project actually asks for. Is it a GWP limit, a percentage reduction, an EPD requirement, or a whole-project carbon report? Confirm the unit, scope, baseline, mix category, strength, exposure class, and submittal deadline.
Step 2: Pull the current mix GWP
Look up the current mix EPD or calculated GWP. Confirm whether it is A1-A3 only or includes A4. Confirm whether the EPD is valid, product-specific, plant-specific, or industry average.
Step 3: Identify the carbon drivers
Break the mix down by cement, SCMs, aggregates, admixtures, water, plant data, and transportation. In most cases, cementitious materials will drive the largest share of GWP.
Step 4: Review aggregate gradation
Run the combined aggregate gradation. Plot it against the Tarantula Curve or another gradation tool. Look for gaps, excess fines, high void content, or poor particle balance that may be increasing paste demand.
Step 5: Reduce paste carefully
Use the gradation review to test whether paste volume can be reduced. Adjust aggregate proportions, water reducers, and cementitious content in small steps. Do not reduce paste so far that the mix becomes harsh, segregating, or difficult to finish.
Step 6: Add SCMs or PLC where appropriate
Evaluate PLC, slag, fly ash, pozzolans, calcined clay, or other accepted materials. Confirm local availability, cost, performance, spec limits, and supplier EPD data.
Step 7: Run trial batches
Check slump, air, unit weight, set time, finishability, pumpability, strength gain, and any durability requirements. Do not rely only on the carbon number. The mix has to work.
Step 8: Recalculate GWP
Update the GWP after mix changes. Compare the optimized mix against the baseline or project limit. Keep the math simple and easy to show in the submittal.
Step 9: Prepare documentation
Submit the mix design, EPD or GWP report, baseline comparison, reduction percentage, trial batch data, and notes on performance. Make it easy for the contractor and engineer to say yes.
Step 10: Save the optimized option
Once a mix works, keep it organized by plant, strength, application, GWP, EPD, and project type. That way, the next bid starts from a better place.
.png)
Field Example 1: Warehouse Slab Mix With High Paste Content
A producer is bidding a large warehouse project. The slab mix is high volume, so even a small GWP reduction could have a large project impact. The original mix performs well, but it has more paste than needed because it was designed years ago and has been carried forward as a safe default.
The QC team reviews the combined aggregate gradation and finds a gap between the fine and coarse aggregate fractions. The mix needs extra paste to stay workable. By adjusting aggregate proportions and adding an intermediate aggregate, the team improves packing and reduces paste demand.
The producer then reduces cementitious content in small steps, uses a water reducer to maintain workability, and confirms finishability through trial batches. The final mix has lower cement content, similar slump, acceptable finishing, and a lower GWP.
Producer lesson: High-volume slab mixes are often the best place to start. A modest cement reduction can create a meaningful project-level carbon reduction because the volume is large.
Field Example 2: DOT Mix With GWP Limit and Early Strength Pressure
A producer is working on a transportation project with a GWP limit. The mix also has early strength expectations because of construction sequencing. The producer cannot simply increase SCM replacement aggressively without risking schedule issues.
Instead, the team uses a balanced approach. They switch to PLC where accepted, optimize aggregate gradation to reduce paste demand, use a water reducer, and add a moderate SCM percentage that still supports the strength timeline. The result is not the lowest possible GWP, but it meets the project limit and keeps the schedule realistic.
Producer lesson: When early strength matters, the best low-carbon mix may be a moderate reduction strategy that balances GWP, performance, and schedule.
Field Example 3: Data Center Asking for Lower-GWP Alternatives
A data center contractor asks for lower-GWP options on several high-volume mixes. The owner is tracking embodied carbon across the project and wants to see the impact of alternate mix designs.
The producer provides three options: the standard mix, a moderate low-carbon mix, and an aggressive low-carbon option. Each option includes GWP, expected strength timing, SCM content, cement type, and placement notes. The contractor chooses the moderate option for most slabs and foundations because it reduces project carbon without adding schedule risk.
Producer lesson: Private owners may not only ask for one compliant mix. They may want options. Producers that can show tradeoffs clearly become more valuable partners.
.png)
Common Mistakes Producers Should Avoid
One common mistake is cutting cement before fixing the aggregate skeleton. If the gradation is poor, reducing paste may make the mix harsh, sticky, or hard to finish. Start with the aggregate structure, then reduce paste carefully.
Another mistake is assuming SCM replacement always lowers risk. SCMs can reduce GWP, but they can also affect early strength, curing, color, finishing, set time, and supply reliability. Use trial batches and field feedback.
A third mistake is comparing GWP numbers without checking the scope. A1-A3 and A1-A4 are not the same. If delivery distance is included, plant location and haul distance can affect the result.
A fourth mistake is ignoring the spec. A low-carbon mix may be technically sound but blocked by cement minimums, SCM caps, or early strength requirements. Producers should flag those conflicts early and request performance-based alternatives.
A fifth mistake is not updating EPDs or GWP data after changing the mix. If the submitted EPD does not reflect the actual mix, the producer may have a documentation problem.
The mix has to pass twice: once in the lab, and once in the submittal.
What to Include in a Low-Carbon Mix Submittal
A strong submittal should make the carbon and performance story easy to understand. The contractor and engineer should not have to guess how the mix meets the requirement. Include:
- Mix ID and plant
- Strength class
- Exposure class
- Slump and air requirements
- Cement type
- Cementitious content
- SCM type and percentage
- Aggregate sources and gradation
- Admixture strategy
- EPD or GWP report
- A1-A3 GWP
- A4 GWP if required
- Baseline or GWP limit
- Reduction calculation
- Trial batch results
- Strength data
- Set time or maturity data if needed
- Performance notes for placement and finishing
.png)
How Climate Earth Helps Producers Optimize and Document Low-Carbon Mixes
Climate Earth helps concrete producers create and manage EPDs, GWP data, baseline comparisons, and low-carbon concrete documentation across plants, mixes, materials, and project requirements. Our platform helps make concrete carbon data easier to calculate, update, and use during bids and submittals.
For mix optimization, that means producers can compare GWP across mix options, see how material changes affect carbon, benchmark against project limits, and organize the documentation needed to support the bid. Instead of treating every low-carbon request as a one-off spreadsheet exercise, producers can build a repeatable workflow.
Why Choose Climate Earth?
- Built for concrete producers: Designed around mixes, plants, materials, GWP, EPDs, and project requirements.
- Practical GWP visibility: See how cement, SCMs, aggregates, and mix changes affect carbon.
- Baseline comparison tools: Compare optimized mixes against project GWP limits, regional baselines, or reduction targets.
- Support for verified EPD workflows: Create and manage EPDs without rebuilding the process from scratch every time a customer asks.
- Useful for bids and submittals: Help sales, QC, and technical teams provide clear carbon documentation when contractors, owners, engineers, DOTs, or agencies ask for it.
- Project carbon reporting: Track GWP by mix and volume when owners ask for whole-project carbon data.
Ready to Get Started? Schedule a demo to see how Climate Earth can help your team create, manage, and use concrete EPDs and GWP data across low-carbon mix design, bids, and submittals.
FAQ: Low-Carbon Concrete Mix Optimization
What is low-carbon concrete mix optimization?
Low-carbon concrete mix optimization is the process of reducing a concrete mix’s GWP while still meeting strength, durability, workability, finishability, and schedule requirements. It usually involves cement reduction, SCMs, aggregate optimization, admixtures, and better documentation.
What is the Tarantula Curve?
The Tarantula Curve is a tool used to evaluate aggregate gradation. It helps producers balance fine, intermediate, and coarse aggregates so the mix can be workable with less paste.
How does aggregate gradation reduce carbon?
Better aggregate gradation can reduce voids and paste demand. Since paste contains cementitious materials, reducing unnecessary paste can help reduce cement content and lower GWP.
Does reducing cement always lower concrete quality?
No, but it has to be done carefully. If the mix is over-designed, cement may be reduced while still meeting performance. Producers should use trial batches and performance data before submitting a lower-cement mix.
What are the best materials for lowering concrete GWP?
Common options include portland-limestone cement, slag, fly ash, natural pozzolans, calcined clay, silica fume, optimized aggregates, and admixtures. The best option depends on region, supply, cost, performance, and project specs.
How much can SCMs reduce GWP?
Moderate SCM use may reduce total mix GWP by around 10% to 20%. Higher SCM replacement can support 20% to 40% or greater reductions where materials, performance, and specifications allow.
How much can PLC reduce GWP?
Portland-limestone cement can often support a 5% to 10% reduction depending on the cement, mix design, and accepted standards. It is often a practical first step but may need to be combined with other strategies for deeper reductions.
Why do performance-based specs matter?
Performance-based specs let producers meet strength, durability, and GWP goals without forcing a fixed recipe. Prescriptive specs can block lower-carbon options by requiring unnecessary cement content or limiting SCMs too aggressively.
What is the first mix producers should optimize?
Start with high-volume mixes that are commonly used in slabs, foundations, paving, and structural work. A modest GWP reduction on a high-volume mix can create a larger project impact than a big reduction on a low-volume specialty mix.
Do optimized mixes need new EPDs?
If the mix changes significantly, the producer may need updated GWP data or a new EPD depending on the program operator, PCR, and project requirement. Producers should confirm before submitting.
Summary: Low Carbon Mix Optimization Is a Competitive Advantage
Low carbon concrete mix optimization is becoming a practical skill for ready-mix producers. As EPDs, GWP limits, Buy Clean policies, DOT requirements, and private owner carbon goals become more common, producers need more than a standard mix catalog. They need the ability to compare, optimize, document, and explain lower-GWP mixes.
The Tarantula Curve and aggregate gradation are important because they help producers reduce paste demand. Cement reduction matters because cement is often the largest carbon driver. SCMs, PLC, admixtures, and performance-based specs help producers go further while still meeting real field requirements.
The best producers will not simply chase the lowest number. They will offer mixes that meet the job, reduce GWP, and come with clear documentation. That is what contractors, engineers, owners, DOTs, and agencies need as low-carbon concrete moves from sustainability language into everyday project specs.
Related articles

Concrete Sustainability: Guide to Sustainable Concrete & Project Examples

Low Carbon Concrete: A Practical Guide