


How to Read a Concrete EPD: Quick, Expert Guide

An Environmental Product Declaration (EPD) is a verified report that discloses a product’s environmental impacts. For concrete, EPDs typically cover Global Warming Potential (GWP), ozone depletion, acidification, and other life-cycle impact indicators per unit of concrete (e.g. per 1 m³).
However, EPDs do not give a simple “rating.” They follow strict Product Category Rules (PCR) and ISO standards (ISO 14025/21930) to ensure consistency. Crucially, two EPDs can be compared only if they use the same methodology, PCR version, functional unit, and scope (e.g. A1–A3 modules).
Even within concrete, mixes can differ hugely in cement type, supplemental materials (SCMs), water/cement ratio, aggregates, admixtures, plant energy, and strength requirements. This guide explains what each section of a concrete EPD means, how to read an example EPD cover page, and practical rules for ensuring fair comparisons in procurement.
.png)
What Is an EPD?
An Environmental Product Declaration, or EPD, is like a nutrition label for a product. Instead of showing calories and ingredients, it shows the product’s environmental impacts, such as its carbon footprint, water use, resource use, and pollution-related impacts. For concrete, the EPD also identifies the specific mix, strength, unit of measurement, and stages of production included in the calculation.
An EPD is created using a Life Cycle Assessment, or LCA. The LCA collects information about the materials, transportation, energy, fuel, and manufacturing processes used to make the product, then calculates the resulting environmental impacts. To make sure the EPD is reliable, the LCA must follow a Product Category Rule, or PCR, which provides a consistent set of instructions for how products in that category should be measured. The final EPD is then reviewed by an independent third party and published through a recognized program operator. EPDs are usually valid for five years, but they may need to be updated sooner if the product or production process changes significantly.
When and How to Compare EPDs
To compare two EPDs fairly, make sure they match on key points. The table below summarizes the main criteria:
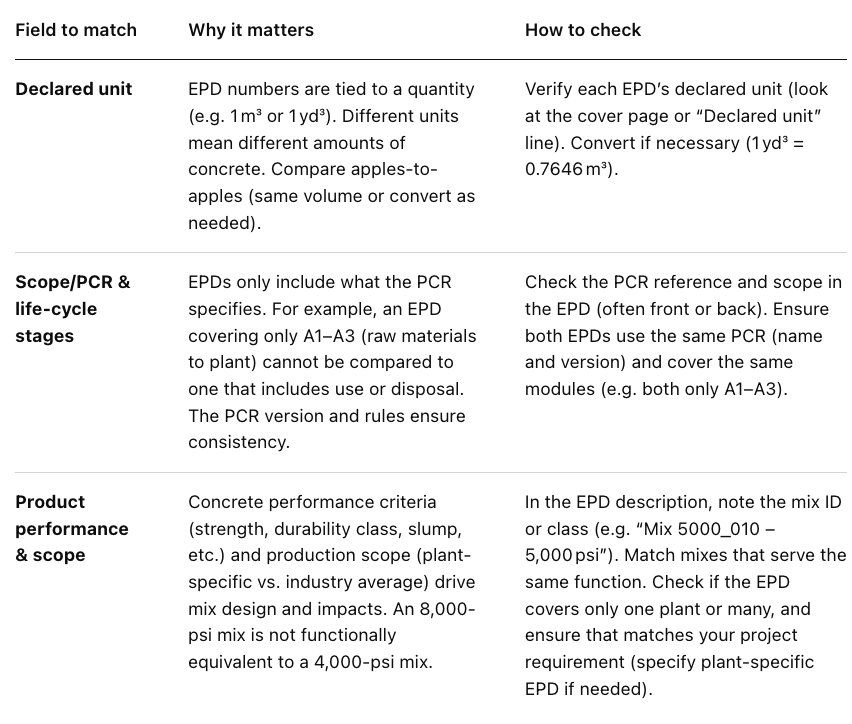
If these fields align, you can then compare impact numbers. If not, do not directly compare the GWP or other values. Instead use them as contextual information. For procurement specs, it is best to require product- or plant-specific EPDs using the same PCR and declared unit as the spec. Avoid using expired EPDs or industry-wide averages unless explicitly allowed (and clarify how they apply).
Example: Reading a Concrete EPD Cover
The example below shows a fictional ready-mix concrete EPD cover page (for Bridge View Concrete, Mix 5000_010, New York Plant). Key fields on the cover are annotated in the text that follows.
- Impact Table – Global Warming Potential (GWP): This is the “carbon footprint.” In our example, GWP is 296 kg CO₂e/m³. This includes CO₂-equivalent emissions from materials and production in scope A1–A3. It does not mean one is low carbon until you ensure comparability (same strength mix, same scope, etc.).
- Issue Date & Expiration: The cover shows “04/08/2025” issued and “Valid until 04/08/2030.” EPDs are typically valid for 5 years. Always use a current (unexpired) EPD. If an EPD’s expiry is past, it may not meet procurement rules even if the product hasn’t changed.
- Declared Unit: Concrete EPDs usually report impacts per 1 m³ and also per 1 yd³. In the impact table, two numbers appear: e.g. “296 (226)” under GWP. The left is per cubic meter (296 kg CO₂e), the right in parentheses is per cubic yard (226 kg CO₂e). Do not misinterpret the smaller number as “better." It’s simply a different unit. Always compare the same unit (the table clearly labels them).
- Compressive Strength: Listed as “5,000 psi at 28 days.” This is one of the first specs to match. A mix’s strength often determines cement quantity. Project specs should require the mix strength and exposure class to match the EPD’s.
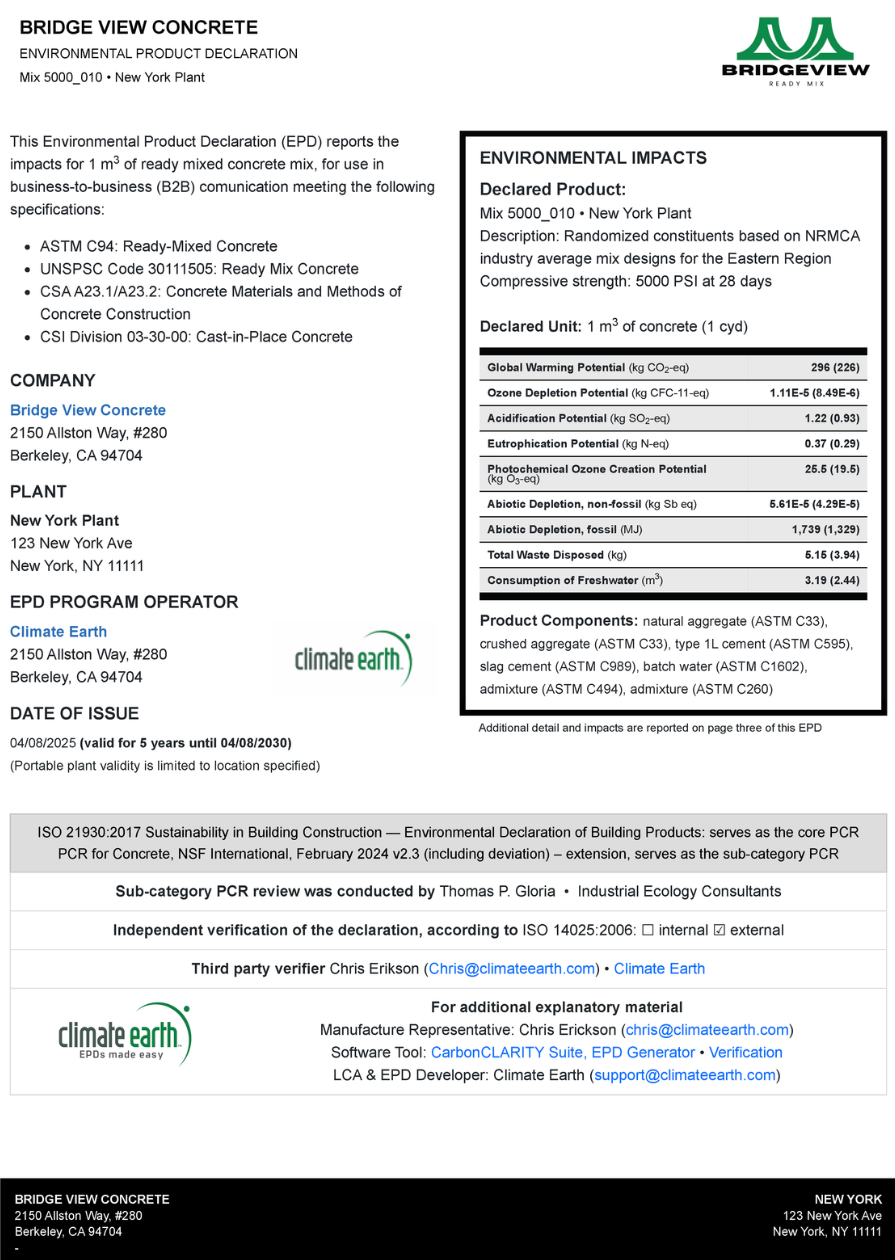
- Declared Product: Often a mix ID or description appears prominently (e.g. “Mix 5000_010 – 5,000 psi Concrete”). This tells you exactly which mix design the EPD results apply to. Never assume an EPD covers a different mix. If a project requires 4,000 psi concrete, you cannot use a 5,000 psi mix’s EPD as a proxy.
- Company: The EPD identifies the manufacturer. Here it’s “Bridge View Concrete.” Always confirm the company matches who is supplying the material. Some EPDs name a subsidiary or brand, so ensure it is the same producer listed in your purchase order.
- Plant: The specific production facility is listed (New York Plant, with address). Use EPDs tied to the actual plant or region where the concrete is made. Two plants can produce different cement or use different aggregates.
- EPD Program Operator: Indicates the verifying body (e.g. NRMCA, ASTM, Kiwa, or other). In our example it’s a fictional program. All reputable EPDs list an operator and independent verifier.
- Product Description: A brief note describing the product. Our example says it’s based on a randomized regional mix. In real EPDs, this might list applicable ASTM classifications or note use of supplementary cementitious materials. Read it to understand whether the EPD used actual site data (preferred) or industry averages.
- Ozone Depletion Potential (ODP): Shown in kg CFC-11e, reflects emissions that could damage stratospheric ozone (the ozone “hole”). (Note: This is not about ground-level smog.)
- Acidification Potential (AP): Shown in kg SO₂e, indicates potential to acidify soil and water (like acid rain).
- Eutrophication Potential (EP): In our example (kg N eq), this reflects potential for nutrient runoff (nitrogen/phosphorus) that can cause algal blooms.
- Photochemical Ozone Creation Potential (POCP): Measured in kg O₃e, this is the potential to form ground-level ozone (smog).
- Abiotic Depletion – Non-Fossil (ADPe) and Fossil (ADPf): Non-fossil depletion (elements) is in kg Sb eq (antimony equivalent), fossil depletion is in MJ. These measure use of non-renewable resources. They complement GWP but are different (fossil MJ shows energy use, not just CO₂).
- Total Waste and Freshwater: These inventory metrics (in kg waste and m³ water) show resource usage and waste output. “Total waste” is the amount of waste the processes generate. “Consumption of freshwater” is the cubic meters of fresh water used in the modeled processes. They provide additional environmental context beyond emissions.
- Product Components: The cover often lists basic ingredients (cement types, aggregates, admixtures). This helps you see what’s in the mix. It will not give exact proportions (those are often proprietary), but it confirms e.g. which cement type and additives were modeled.
- Product Category Rule (PCR): The PCR title or reference (and version) is listed. This is the rulebook followed for the EPD. It defines everything from impact categories to functional unit. When comparing EPDs, ensure they follow the same PCR (or closely aligned rules).
- Verification: The EPD shows that a qualified verifier approved it (often named at bottom). This attests the data and LCA method meet the PCR and ISO 14025 requirements. Look for “externally verified” or an auditor’s statement.
- Tip: Always read the fine print of an EPD. The cover page summarizes the key facts, but the full EPD report (a few pages) explains data sources, assumptions, and boundaries. The GWP number on the cover is only meaningful if the declared unit, mix design, life-cycle stages, and verification are all aligned with your project needs.
Comparison Checklist for Specifiers
When writing specs or evaluating bids, be explicit. For example, a concrete spec might require: “Provide a product-specific, third-party verified EPD (ISO 14025) for each mix design, covering at least life-cycle stages A1–A3, with results reported per 1 m³ of concrete. EPDs must cite the applicable PCR (including version) and provide compressive strength and durability class information.” Avoid vague language like “provide an EPD” without clarifying these points.
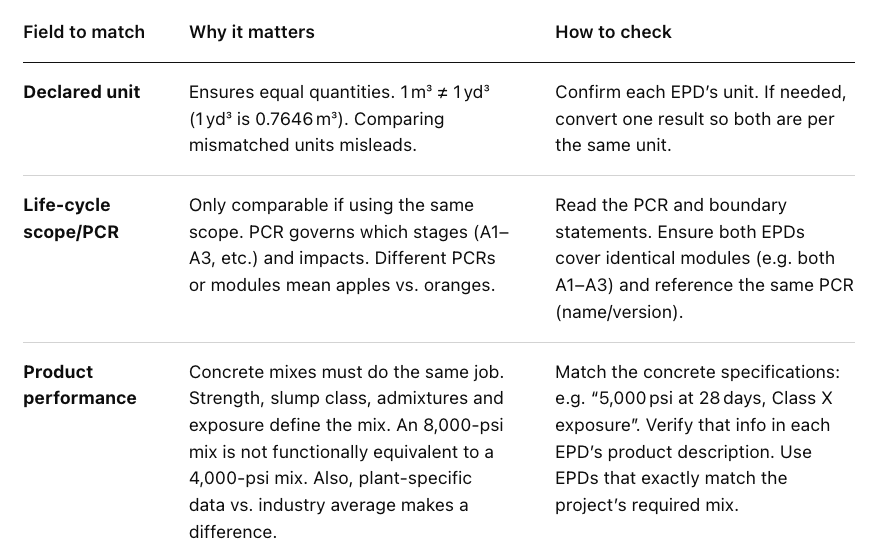
By following this checklist, the GWP and other results can be compared meaningfully. For instance, if both EPDs use “1 m³, A1–A3, 5,000 psi concrete, PCR v3”, then the lower GWP is legitimately the greener mix.
Conclusion
An EPD is a disclosure tool, not an environmental grade. The most important rule is: don’t look at a single number without context. Always confirm the product scope, declared unit, life-cycle boundary, PCR, plant/location, mix strength, and verification status. When properly matched, concrete EPDs can be compared to guide low carbon choices (e.g. in Buy Clean or LEED criteria).
When in doubt, require fully documented, current, product-specific EPDs in specs, and ask suppliers to explain any differences in mix composition or data assumptions. Armed with these insights, architects, engineers, and contractors can use EPDs to make informed decisions on concrete with confidence.
Related articles

LEED v5 Requirements: What They Mean for Low Carbon Concrete

Concrete Sustainability: Guide to Sustainable Concrete & Project Examples